 Scorify.uz
How to Describe a Graph in IELTS Writing Task 1 (Model Overview + Practice)
IELTS Academic Writing Task 1 asks you to describe visual information: a line graph, a bar chart, a pie chart, a table, a map or a process diagram. You have about 20 minutes and must write at least 150 words. Many candidates lose marks not because their English is weak but because they describe the data in the wrong way: they list numbers, forget the overview or explain reasons that the chart never mentions.
This guide gives you a clear method for describing any graph, a bank of the language you need and a checklist you can use before you submit. You will also see exactly what a strong overview looks like.
What examiners want in Task 1
Task 1 is marked on four criteria, equally weighted: Task Achievement, Coherence and Cohesion, Lexical Resource, and Grammatical Range and Accuracy. For Task Achievement, you must select and report the key features, make comparisons where relevant and include a clear overview. You should not copy every number, and you should not give opinions or explanations.
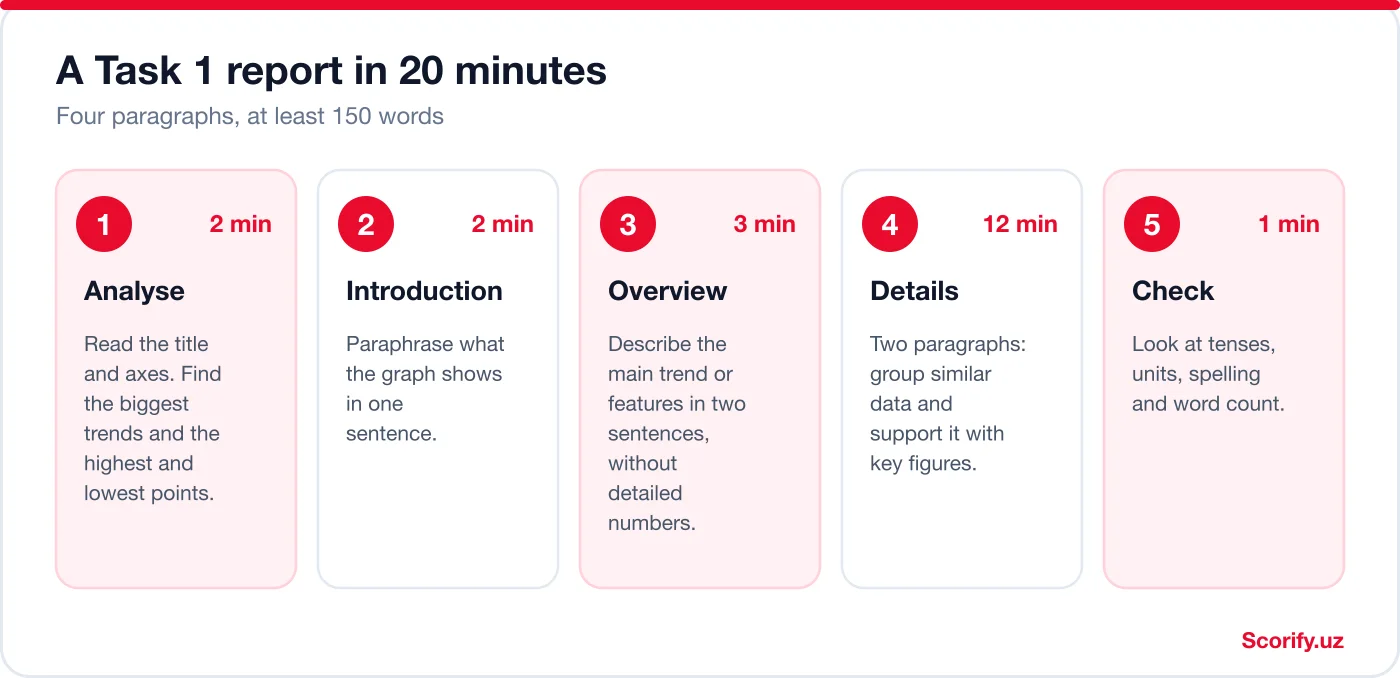
The 20-minute plan
Step 1: Analyse before you write
Read the title and the labels on the axes first. Then ask three questions: What is the main trend? What are the highest and lowest points? Which items are similar and which are different? Underline or circle two or three features. If you cannot decide what is important, you cannot write a good overview.
Step 2: Introduce the graph in one sentence
Paraphrase the question. Change the verb, the nouns and the structure. For example:
- Question: The graph shows the percentage of the population who used the internet in four countries between 2000 and 2020.
- Introduction: The line graph illustrates how the proportion of people using the internet changed in four countries over a twenty-year period.
Step 3: Write an overview with no detailed numbers
The overview is the most important paragraph in Task 1. It states the main trends or the most striking features in two sentences, using general words. For the graph below, a good overview is:
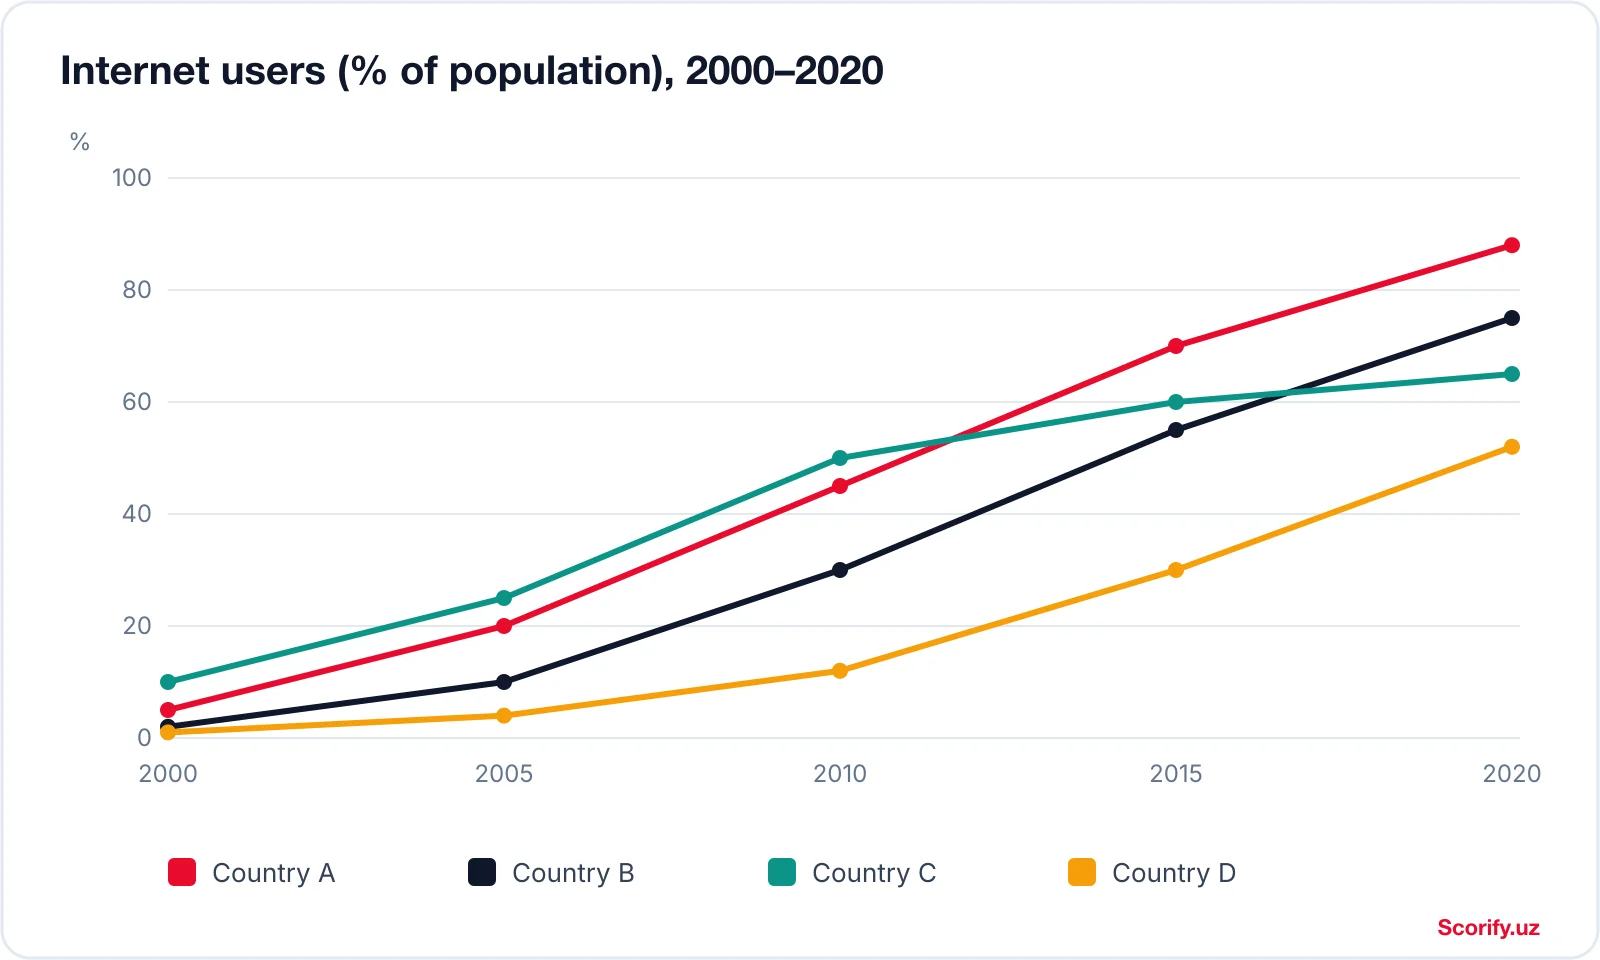
Overview: Overall, internet use rose significantly in all four countries. Country A showed the strongest growth and ended with the highest figure, whereas Country D remained the lowest throughout.
Notice that there are no numbers. The overview answers two questions: what happened in general, and which item was highest or lowest.
Step 4: Write two detail paragraphs
Group the data logically. For this graph, you could describe the two leading countries in one paragraph and the other two in the other. Support each general statement with figures: “Country A rose from 5% to 45% between 2000 and 2010, and reached 88% by 2020.” Compare as you go, using words such as whereas, compared with and in contrast.
Step 5: Check
Spend the last minute checking tenses, units (%, thousand, °C), spelling and the number of words. Task 1 requires at least 150 words, and writing less can lower your score.
You can see a complete report for this graph, including useful language, in our Task 1 line graph sample.
Worked example: describe a line graph step by step
Here is a complete example from start to finish. The chart below was made for this lesson and its numbers are invented: it is not real library data.
Step 1: read the chart and decide what matters
- What is measured? Average monthly visits, in thousands, for three libraries, every five years from 2000 to 2020.
- Main trends: Riverside goes up, Central goes down, Hillside stays almost flat.
- Interesting moment: the lines for Riverside and Central cross between 2010 and 2015.
Step 2: write the report
Introduction. The line graph shows how many visits were made each month to three libraries in an imaginary city between 2000 and 2020, measured in thousands.
Overview. Overall, visits to Riverside Library rose steadily, whereas Central Library lost visitors, so the two libraries swapped places. Hillside Library was the least busy throughout, and its figure barely changed.
Details 1. In 2000, Central Library was by far the busiest, with 58 thousand visits, almost double the 30 thousand recorded at Riverside Library. The gap between them narrowed from 28 thousand in 2000 to only 6 thousand in 2010, and by 2015 Riverside was ahead with 52 thousand visits compared with 41 thousand. By 2020, Riverside had climbed to 61 thousand, while Central had fallen gradually to 36 thousand.
Details 2. Hillside Library, in contrast, stayed within a narrow range of 20 to 23 thousand visits and ranked last at every point shown. Its 2020 figure of 22 thousand was only 2 thousand higher than in 2000.
The overview has no numbers: it names the two trends and the item that stays lowest. Every number appears later, inside a comparison.
How to choose which numbers to mention
This graph has 15 data points (three lines, five years each). The report above uses only about ten of them. Choosing is the skill the examiner is looking for in Task Achievement: you are asked to select and report the main features, not to copy the chart.
| What to report | Why | In this example |
|---|---|---|
| Start and end of each main line | Shows the overall change | Central 58 → 36; Riverside 30 → 61 |
| Highest and lowest points | Backs up the overview | Highest point on the chart: Riverside, 61 in 2020. Lowest: Hillside, 20 in 2000 |
| Where lines cross or the gap changes | Gives you a real comparison | Gap of 28 in 2000, 6 in 2010; Riverside ahead by 2015 |
| A flat line | Summarise it; do not list every point | Hillside stayed between 20 and 23 |
A useful test for each number: does it support a trend, a comparison or an extreme? If not, leave it out. As a rule of thumb (our advice, not an official rule), a chart this size needs roughly six to ten figures in the whole report, and every figure should come with its unit and year.
The language of change
Using only “increase” and “decrease” will limit your Lexical Resource score. Use a range of verbs, adjectives and adverbs, but make sure that you use them accurately.
| Idea | Verbs and nouns | Adverbs and adjectives |
|---|---|---|
| Going up | rise, increase, grow, climb; a rise, an increase | sharply, significantly, steadily, gradually |
| Going down | fall, decrease, decline, drop; a fall, a decline | slightly, considerably, rapidly, slowly |
| Staying the same | remain stable, stay constant, level off | unchanged, steady |
| Going up and down | fluctuate; a fluctuation | erratically, repeatedly |
| Highest and lowest | peak at, reach a peak of, hit a low of, bottom out at | the highest, the lowest, the greatest |
Tenses in Task 1
- If the data refers to a past period (for example 2000–2020), use the past simple: rose, fell, remained.
- If it refers to the present or gives no dates, use the present simple: shows, accounts for.
- If it includes a future projection, use is expected to, will or is predicted to.
- For processes, use the present simple passive: is heated, are collected.
Six mistakes that lower your Task 1 score
- No overview. Without it, your Task Achievement score is limited.
- Listing every number. Select the most important ones and group data.
- Giving reasons. Do not write “because people bought more smartphones”; the chart does not say why.
- Personal opinions. Avoid “I think” and “unfortunately”.
- Wrong tense. Check whether the dates are in the past.
- Missing units and comparisons. Always write what the figure measures and compare items where relevant.
Your Task 1 checklist
- Did I paraphrase the question in the introduction?
- Does my overview state the main trend or feature without detailed numbers?
- Have I grouped data and made comparisons?
- Are all figures correct and given with units?
- Did I use a range of vocabulary for change and comparison?
- Do I have at least 150 words?
Practise with real charts
The best way to improve is to describe many different charts and compare your report with a model. Our Task 1 sample library contains line graphs, bar charts, pie charts, tables and a process diagram, each with the chart, an analysis, a Band 7 report and useful language. When you have written your own report, submit it to Scorify to get an estimated band and corrections on grammar and vocabulary.
Practice task: describe a second data set
Now try it yourself. Spend about 15 minutes. The data is again fictional.
| Percentage of students who… | 2010 | 2020 |
|---|---|---|
| take the bus | 45 | 30 |
| cycle | 15 | 28 |
| walk | 25 | 24 |
| come by car | 15 | 18 |
Your task: write an introduction, an overview (two sentences, no detailed numbers) and one paragraph of details. Aim for at least 150 words in total, and use the past simple. Choose your numbers with the table above in mind: which change is the biggest, and which category hardly moved?
Show a sample overview and details paragraph
Overview. Overall, the bus remained the most common way to reach the college but lost ground, while cycling showed the biggest rise. Walking was almost unchanged.
Details. In 2010, 45% of students took the bus, almost twice the share of walkers (25%), while bicycles and cars were each used by 15%. By 2020 the bus share had dropped to 30%, but the proportion cycling had risen to 28%, nearly matching it. Walking stayed close to a quarter (25% in 2010 and 24% in 2020), and car use rose slightly from 15% to 18%.
Compare it with yours: did you mention the biggest rise and the biggest fall? Did you keep the numbers out of your overview? There is more than one good answer, so look at the choices rather than the exact words.
Frequently asked questions
How many words should I write in Task 1?
You must write at least 150 words. Strong reports are usually 160 to 190 words and take about 20 minutes, leaving a minute for checking.
Is the overview really necessary?
Yes. A report without a clear overview is limited in the Task Achievement criterion, however well written the rest may be.
Should I describe every number in the chart?
No. Choose the key features, such as the highest and lowest values, major trends and important comparisons, and support them with selected figures.
Can I use “I think” or give reasons for the data?
No. Describe only what the chart shows. Do not add opinions, predictions or explanations that are not in the data.
What is the difference between Academic and General Training Task 1?
Academic Task 1 asks you to describe a graph, chart, table, map or process. General Training Task 1 asks you to write a letter. This guide is for the Academic test.
For the other half of the Writing score, see our guide to the Task 2 essay structure, and for an overview of how the scores are given, read IELTS band scores explained.
Scorify.uz provides independent practice and estimated scores. Only an official IELTS test gives an official band score.
Sources
This is a simplified summary of public IELTS information. For the current rules, check the official sources: ielts.org (IELTS), IDP IELTS: band score calculation and British Council IELTS. Test centres have the final word on your test day.